
Dubai Property Data: Why One Percentage Can Mislead Buyers, Sellers, and Investors

admin
Published on July 1, 2026
Quick Answer
Dubai property data cannot be understood from one percentage alone.
Year-on-year, or YoY, compares today’s market with the same period last year. It helps show the bigger trend and reduces seasonal distortion.
Month-on-month, or MoM, compares today’s market with the previous month. It helps show current momentum and early turning points.
But in Dubai, both can mislead if they are read alone. The real answer comes from reading YoY, MoM, and transaction mix together. Dubai Land Department’s public data covers multiple real estate categories, including transactions, rents, projects, valuations, land, buildings, units, brokers, and developers, which shows why serious analysis must go deeper than one headline percentage.
Key Takeaways
• YoY shows the market’s broader position compared with last year.
• MoM shows short-term movement and momentum.
• YoY can hide fresh turning points because it looks backward over a full year.
• MoM can exaggerate short-term noise because Dubai has seasonality, project handovers, and uneven transaction volume by area.
• Dubai’s market must be segmented by community, property type, bedroom type, ready versus off-plan, and price bracket.
• Off-plan and ready transactions should not be mixed blindly because they behave differently.
• A 3-month rolling MoM view is usually cleaner than one monthly movement.
• The best market read is not “prices are up” or “prices are down.” It is: which segment is moving, why it is moving, and whether the movement is real.
The Problem With Dubai Property Headlines
Most market headlines sound simple.
“Dubai prices rise.”
“Dubai sales fall.”
“Off-plan demand surges.”
“Average price per sqft increases.”
The problem is that one percentage rarely explains the full market.
Dubai is not one property market. It is many markets moving at the same time.
Business Bay apartments can move differently from Palm Jumeirah villas.
Ready homes can behave differently from off-plan launches.
Luxury waterfront units can move differently from investor studios.
A handover-heavy community can show sudden transaction jumps that do not represent real price growth.
That is why reading one citywide percentage can create the wrong decision.
For investors, the risk is buying because the headline looks strong.
For sellers, the risk is overpricing because the yearly number looks positive.
For buyers, the risk is waiting for a correction in a segment that is still undersupplied.
The market has to be read with more discipline.
What YoY Really Tells You
YoY means year-on-year.
It compares one period with the same period one year earlier.
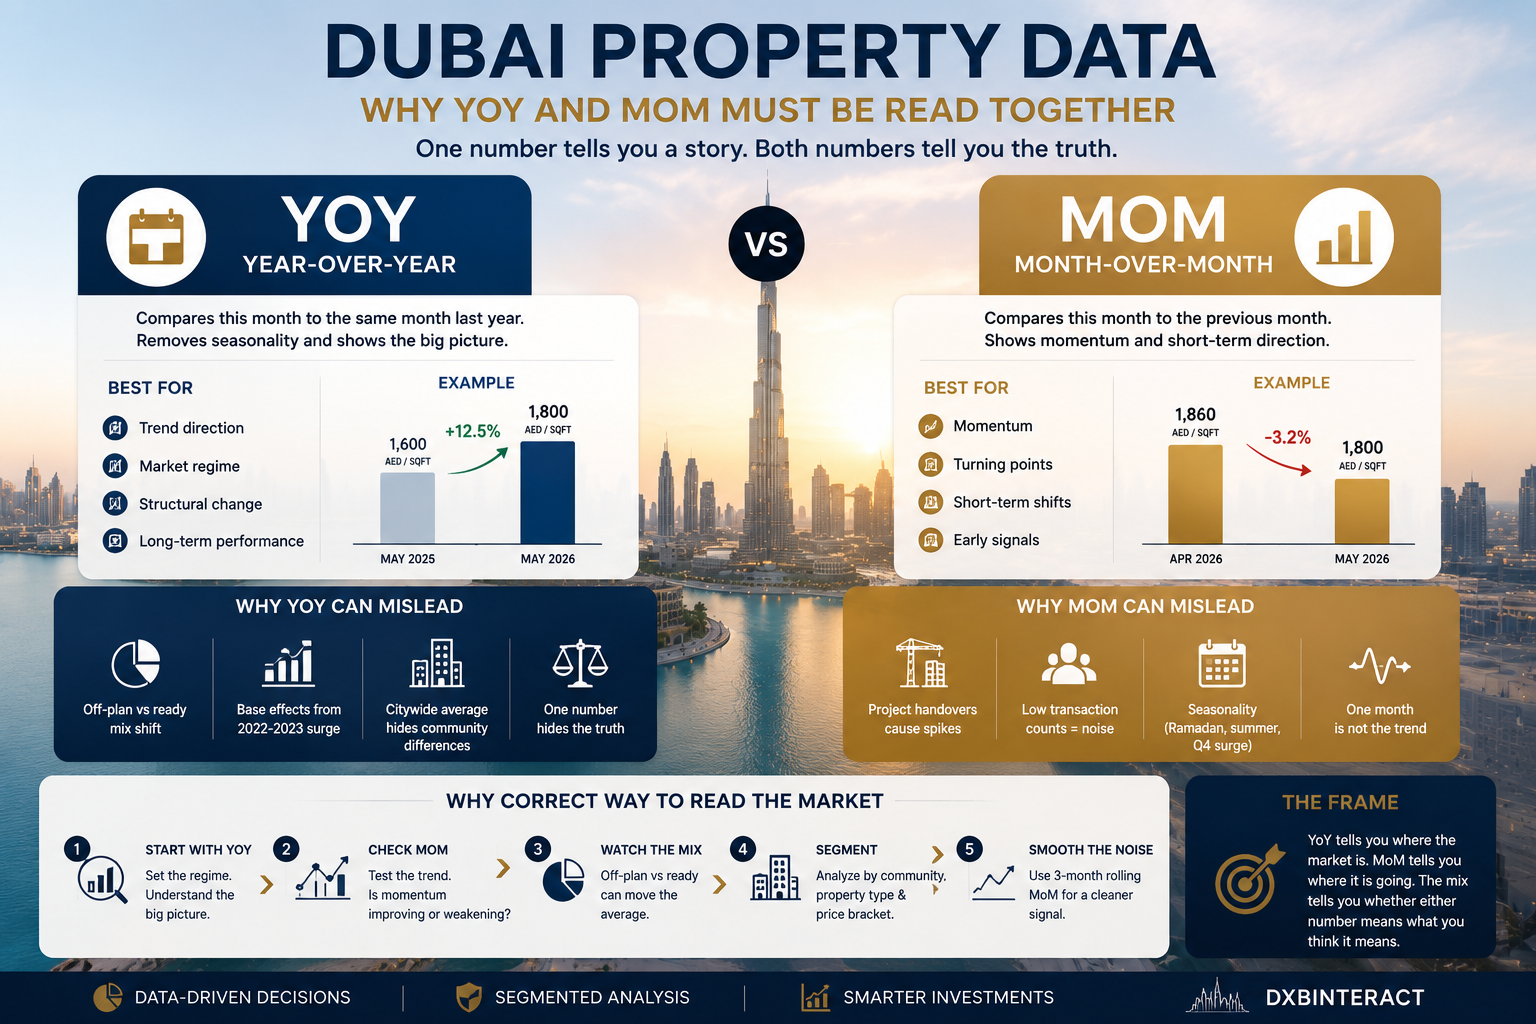
For example, if May 2026 average price per sqft is AED 1,800 and May 2025 was AED 1,600, the YoY growth is 12.5%.
YoY is useful because it helps remove some seasonality. Comparing May with May is usually cleaner than comparing May with April because Dubai’s activity can be affected by Ramadan, summer travel, school calendars, developer launch timing, and year-end activity.
YoY is best for answering:
• Is the market higher or lower than last year?
• Is the long-term trend still positive?
• Is this community structurally improving?
• Are prices above or below the same period last year?
• Is transaction value growing over a longer period?
YoY gives context.
But YoY is not fast.
A market can begin cooling today while YoY still looks strong because the comparison is still against last year’s lower base.
That is where investors get trapped.
What MoM Really Tells You
MoM means month-on-month.
It compares the current month with the previous month.
For example, if May 2026 average price per sqft is AED 1,800 and April 2026 was AED 1,860, the MoM change is negative 3.2%.
MoM is useful because it reacts faster than YoY.
It can show:
• Buyer hesitation
• Slower absorption
• Seller discounting
• Sudden demand increase
• Momentum shifts
• Early market turning points
MoM is best for answering:
• Is demand changing now?
• Are buyers slowing down?
• Are prices losing momentum?
• Is a community heating up or cooling down?
• Are transactions accelerating or weakening?
MoM gives speed.
But MoM can be noisy.
One major project handover, one bulk registration, one luxury villa sale, or one quiet seasonal month can distort the result.
That is why one monthly movement should not be treated as a final conclusion.
Why YoY Can Mislead in Dubai
1. Off-plan and ready property get mixed together
Dubai has a very large off-plan market.
Off-plan sales are often driven by launch campaigns, payment plans, developer pricing, broker networks, and investor sentiment.
Ready sales are more connected to live occupancy, mortgage affordability, rental income, actual viewings, seller motivation, and end-user demand.
When these two markets are mixed together, the average number can become misleading.
If off-plan activity rises sharply, citywide prices may look stronger even if ready property prices are flat.
If ready resale slows but off-plan launches perform well, the headline may still look positive.
That does not mean every property owner can sell higher.
It means the transaction mix changed.
2. Base effects can hide the real story
YoY compares today with last year.
If last year was unusually strong, this year can look weak even if the market is still healthy.
If last year was unusually soft, this year can look very strong even if the current market is only normal.
This is called a base effect.
Dubai has had several periods of strong transaction growth, especially after 2020. That makes YoY comparisons more complicated because some months are being compared against record-level activity.
A negative YoY number does not always mean the market is collapsing.
A positive YoY number does not always mean the market is still accelerating.
The base matters.
3. Citywide averages hide community reality
Citywide data is useful for direction, but it is not enough for decision-making.
Dubai Marina, JVC, Downtown Dubai, Dubai Hills Estate, Palm Jumeirah, Business Bay, Dubai South, and Wadi Al Safa do not move the same way.
One area can be rising because of strong end-user demand.
Another can be slowing because of too much new supply.
Another can show price growth only because luxury units sold that month.
Another can look weak because there were too few transactions.
This is why citywide YoY should never be the final answer.
It should be the start of the analysis.
Why MoM Can Mislead in Dubai
1. Project handovers can distort the month
When a major project hands over, many transactions can appear in the same period.
That can create a sudden spike in volume or price per sqft.
The following month may look weaker simply because the handover wave passed.
This does not necessarily mean the community became stronger one month and weaker the next.
It may only mean the registration calendar changed.
Dubai Land Department’s real estate transaction service separates transaction types such as sales, mortgages, and gifts, which is useful because monthly market movement can be affected by what type of activity is being recorded.
2. Smaller communities have low sample sizes
MoM is dangerous in communities with few transactions.
If only 10 or 20 properties sell in a month, one expensive villa or one distressed sale can move the average.
That does not mean the whole community changed value.
For smaller areas, MoM must be read with caution.
A better approach is to look at:
• 3-month average
• Median instead of average
• Similar property types
• Similar unit sizes
• Actual sold comparables
• Transaction count
Without enough transactions, MoM can become noise.
3. Dubai has real seasonal behaviour
Dubai’s property market is affected by seasonality.
Ramadan, summer travel, school movement, Q4 relocation activity, and developer launch calendars can all affect transaction behaviour.
Some recent reporting even suggested that Ramadan 2026 activity remained strong, with betterhomes expecting an 8% to 12% rise in activity during Ramadan 2026, which shows that seasonality does not always mean slowdown, but it does mean the calendar must be understood before reading monthly data.
This is why comparing August with July or December with November can be misleading without context.
MoM treats the calendar as if every month is equal.
Dubai’s calendar is not equal.
The Correct Way to Read Dubai Property Data
Step 1: Start with YoY
Use YoY to understand the bigger market position.
Ask:
• Is this segment higher or lower than last year?
• Is transaction value growing?
• Is price per sqft structurally higher?
• Is the community improving over time?
• Is the yearly trend still positive?
YoY tells you the regime.
Step 2: Check MoM
Use MoM to test whether the trend is still moving.
Ask:
• Is momentum improving or weakening?
• Are buyers still absorbing stock?
• Are prices moving up or down recently?
• Is the latest movement consistent or random?
• Is there a turning point before YoY shows it?
MoM tells you the direction.
Step 3: Separate ready and off-plan
This is critical in Dubai.
Never read off-plan and ready property as one simple number.
Off-plan analysis should focus on:
• Launch price
• Payment plan
• Developer reputation
• Handover date
• Future supply
• Resale before completion
• Investor absorption
Ready property analysis should focus on:
• Actual comparable sales
• Rentability
• Mortgage demand
• Seller motivation
• Service charges
• Current inventory
• End-user demand
These are different markets.
They must be read separately before being combined.
Step 4: Segment by community and property type
A serious market read should be broken down by:
• Community
• Building or project
• Apartment, villa, townhouse, plot, or commercial
• Ready versus off-plan
• Bedroom type
• Price bracket
• Average and median price per sqft
• Transaction volume
• Rental trend
• Future supply
This is where the real market appears.
A citywide number may be good for a headline.
A segmented number is what buyers and sellers actually need.
Step 5: Use a 3-month rolling MoM
One month can lie.
Three months usually gives a cleaner signal.
If MoM falls once, it may be noise.
If MoM falls for three months, it may be a trend.
If MoM rises once, it may be one project.
If MoM rises for three months, demand may be building.
A 3-month rolling MoM view helps remove the noise caused by handovers, one-off luxury sales, and seasonal timing.
Example: Why One Headline Can Be Wrong
Imagine a community shows:
• YoY price growth: +12%
• MoM price movement: -4%
• Off-plan share increased sharply
• Ready transaction volume declined
• Active listings increased
• Sellers started accepting discounts
A headline may say:
“Prices are up 12%.”
But the real market read is different.
The community is still higher than last year, but current momentum may be weakening. The YoY growth may be supported by off-plan activity, while the ready market is showing softer demand.
That is why YoY alone can mislead.
Now imagine another community shows:
• YoY price growth: -3%
• MoM price movement: +4%
• Transaction volume rising
• DOM falling
• Rents improving
• Inventory tightening
A headline may say:
“Prices are down year-on-year.”
But the real read may be that the community is recovering from last year’s high base and momentum is improving now.
That is why MoM matters.
What Buyers Should Do
Buyers should not make decisions based only on citywide YoY headlines.
Before buying, check:
• Recent sold prices in the exact building or community
• Ready versus off-plan split
• MoM trend over three months
• Rental yield
• Future supply
• Current active listings
• Days on Market
• Seller discounting
• Similar unit availability
• Service charges
A buyer’s strongest advantage is not predicting the whole Dubai market.
It is understanding the exact segment they are buying into.
What Sellers Should Do
Sellers should avoid pricing only from last year’s market.
If YoY is positive but MoM is weakening, sellers should be careful.
That may mean the market is still higher than last year, but buyers are becoming more selective now.
A seller should check:
• Current competition
• Recent actual sold prices
• How long similar listings are staying online
• Buyer enquiry quality
• Whether prices are reducing nearby
• Whether the property is rare or easily replaceable
• Whether the area is supported by rental demand
In a strong market, sellers can push.
In a selective market, correct pricing wins.
What Investors Should Do
Investors should use YoY and MoM as part of a wider framework.
A good investment signal may include:
• Positive YoY
• Stable or improving MoM
• Rising transaction volume
• Strong rent growth
• Healthy yield
• Low future competing supply
• Strong resale liquidity
• Falling Days on Market
• Limited seller discounting
A warning signal may include:
• Positive YoY but negative MoM for several months
• Rising inventory
• Falling rents
• Developer incentives increasing
• High future supply
• Weak resale transactions
• Rising Days on Market
• Prices rising faster than rents
Investors should not ask only, “Is Dubai up or down?”
They should ask:
Which segment is strengthening, which segment is weakening, and what is the transaction mix telling me?
CBA Real Estate Market View
At CBA Real Estate LLC, our view is that Dubai property data must be read with discipline.
The market is too fast, too segmented, and too mix-sensitive for one headline percentage to explain reality.
YoY tells you where the market stands.
MoM tells you where momentum is moving.
Transaction mix tells you whether the number is real.
If you read only YoY, you may miss turning points.
If you read only MoM, you may panic over noise.
If you ignore off-plan versus ready, you may misunderstand the entire market.
The strongest investors, buyers, sellers, and agents will not follow one percentage.
They will read the data properly.
In Dubai real estate, the headline is rarely the full truth.
The real truth is in the breakdown.
FAQs
What is YoY in Dubai real estate?
YoY means year-on-year. It compares a property market metric with the same period one year earlier. It is useful for understanding the bigger trend and reducing seasonal distortion.
What is MoM in Dubai real estate?
MoM means month-on-month. It compares a metric with the previous month. It is useful for identifying short-term momentum and possible turning points.
Which is better, YoY or MoM?
Neither is better by itself. YoY is better for long-term trend context. MoM is better for short-term momentum. The best analysis uses both together.
Why can YoY be misleading?
YoY can be misleading because of base effects, off-plan and ready property mix shifts, and citywide averages that hide community-level differences.
Why can MoM be misleading?
MoM can be misleading because of project handovers, small sample sizes, seasonal timing, and one-off high-value transactions.
Why is transaction mix important in Dubai?
Transaction mix matters because off-plan, ready, villas, apartments, plots, and commercial properties all behave differently. If the mix changes, the average price can move even if real property values have not changed equally.
How should investors read YoY and MoM together?
Investors should use YoY to understand the broader trend, MoM to test current momentum, and transaction mix to confirm whether the movement is real. A 3-month rolling MoM view is usually safer than one monthly reading.
Should I trust citywide Dubai property averages?
Citywide averages are useful for a quick market overview, but they are not enough for buying, selling, or investing decisions. Always check the specific community, building, property type, and transaction type.